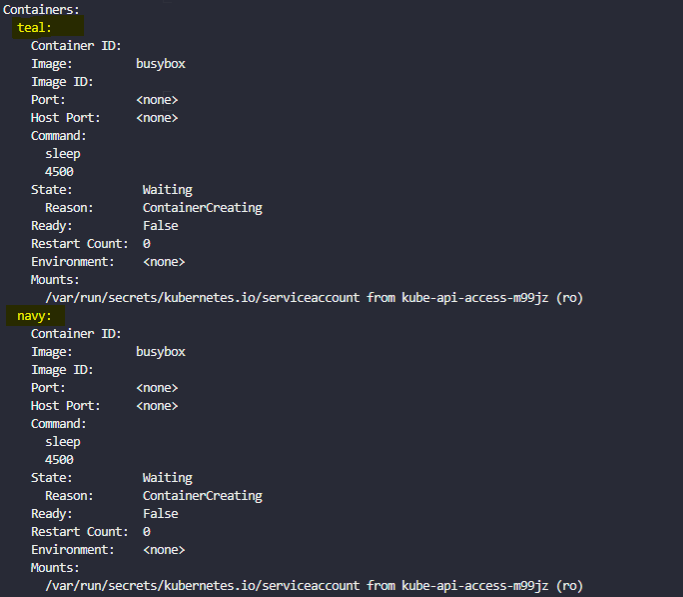
1. Identify the number of containers created in the red pod.
# k get pods

A) 3
2.Identify the name of the containers running in the blue pod.
# k describe pods blue

A) teal & navy
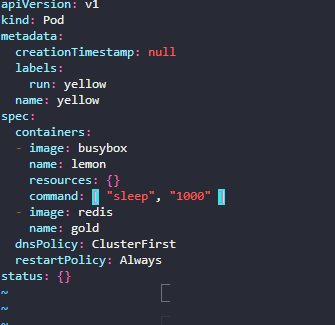
3. Create a multi-container pod with 2 containers. Use the spec given below.
If the pod goes into the crashloopbackoff then add the command sleep 1000 in the lemon container.
-
Name: yellow
-
Container 1 Name: lemon
-
Container 1 Image: busybox
-
Container 2 Name: gold
- Container 2 Image: redis
# k run yellow --image=busybox --dry-run=client -o yaml > yellow.yaml
# vi yellow.yaml
# k apply -f yellow.yaml


4.We have deployed an application logging stack in the elastic-stack namespace. Inspect it.
Before proceeding with the next set of questions, please wait for all the pods in the elastic-stack namespace to be ready. This can take a few minutes.
# k get pods -n elastic-stack

5. Once the pod is in a ready state, inspect the Kibana UI using the link above your terminal.
There shouldn't be any logs for now. We will configure a sidecar container for the application to send logs to Elastic Search.
NOTE: It can take a couple of minutes for the Kibana UI to be ready after the Kibana pod is ready.
You can inspect the Kibana logs by running:
kubectl -n elastic-stack logs kibana

A) ok
6.Inspect the app pod and identify the number of containers in it.
It is deployed in the elastic-stack namespace.
# k describe pod app -n elastic-stack

A) 1
7.The application outputs logs to the file /log/app.log. View the logs and try to identify the user having issues with Login.
Inspect the log file inside the pod.
# kubectl log app -n elastic-stack
: 확인했으나 user5 에 lock 가 걸린걸 확인 할 수 있음
error) USER5 Failed to Login as the account is locked due to MANY FAILED ATTEMPTS.
# kubectl -n elastic-stack exec -it app -- cat /log/app.log
A) User5
8.Edit the pod to add a sidecar container to send logs to Elastic Search. Mount the log volume to the sidecar container.
Only add a new container. Do not modify anything else. Use the spec provided below.
-
Name: app
-
Container Name: sidecar
-
Container Image: kodekloud/filebeat-configured
-
Volume Mount: log-volume
-
Mount Path: /var/log/event-simulator/
-
Existing Container Name: app
- Existing Container Image: kodekloud/event-simulator
# k edit pod -n elastic-stack
# k replace --force -f /tmp/kubectl-edit-4052131168.yaml


9.Inspect the Kibana UI. You should now see logs appearing in the Discover section.
You might have to wait for a couple of minutes for the logs to populate. You might have to create an index pattern to list the logs. If not sure check this video: https://bit.ly/2EXYdHf
A) ok
'cloud > k8s(문제풀이)' 카테고리의 다른 글
| [cka]kodekloud-upgrades ( 조금 더 공부 필요) (0) | 2022.06.17 |
|---|---|
| [cka]kodekloud-initContainer (0) | 2022.06.17 |
| [cka]kodekloud-secrets (0) | 2022.06.16 |
| [cka]kodekloud-Env Variables (0) | 2022.06.15 |
| [cka] kodekloud-commands and Arguments (0) | 2022.06.15 |


